

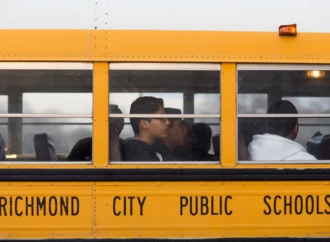
It’s the end of the school year and by now just about every graduating senior has donned cap and gown and walked across the stage to receive his or her diploma.
Statistics place national graduation rates at 81% – a percentage that has risen amidst much acclamation in recent years. But according to an investigation by NPR, such a rosy number doesn’t necessarily indicate increased academic achievement. Instead, increased fudging may be the true reason graduation rates are on the rise.
This fudging occurs first through mislabeling:
“Basically, we found that many high schools in the city were mislabeling students when they left. They were saying they were moving out of town or going to private schools when, in reality, they were enrolling at the district’s alternative schools or, in some cases, GED programs.
And we should say — alternative schools are common in big-city districts. They’re for at-risk students who are behind in credit. But they’re generally still part of the public school system.”
In other words, a district can officially say that a student is not part of a graduating class because they have “left the district,” when in reality, they have just been transferred to other programs – technically not in the district – for further education. This removes struggling students from the total graduating class size, thus driving up the percentage of students who earn a diploma.
NPR also notes that graduation rates are inflated by students who fail courses or graduation exams, but are then given easier work and tests until they achieve success. Such practices lead NPR to conclude that the national graduation rate “isn’t worth the paper it’s printed on.”
Below are ten states (plus D.C.) which have the worst graduation rates in the country. They’re pretty bad… but given NPR’s report, are they actually much worse than the official numbers describe?


Leave a Comment
Your email address will not be published. Required fields are marked with *